이 수비학적인 값들의 분포를 시각화하면 그림 1-1과 같습니다.
# words = <다른 원본에서 새로 생성한 목록>
import matplotlib.pyplot as plt                         # ➊
plt.plot([word_number(word) for word in words])
plt.title(f"Magic values of {len(words):,} generated words")
plt.show()
➊ pip install matplotlib 또는 conda install matplotlib
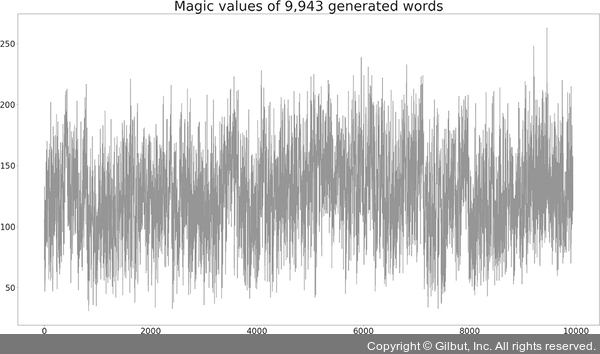
▲ 그림 1-1 생성된 단어의 마법 숫자