수정된 plot_decision_regions 함수에 결과 그래프에 표시할 테스트 샘플 인덱스를 지정할 수 있습니다. 코드는 다음과 같습니다.
>>> X_combined_std = np.vstack((X_train_std, X_test_std)) >>> y_combined = np.hstack((y_train, y_test))
>>> plot_decision_regions(X=X_combined_std,
...                       y=y_combined,
...                       classifier=ppn,
...                       test_idx=range(105, 150))
>>> plt.xlabel('petal length [standardized]')
>>> plt.ylabel('petal width [standardized]')
>>> plt.legend(loc='upper left')
>>> plt.tight_layout()
>>> plt.show()
결과 그래프에서 볼 수 있듯이 세 개의 붓꽃 클래스는 선형 결정 경계로 완벽하게 분류되지 못합니다.
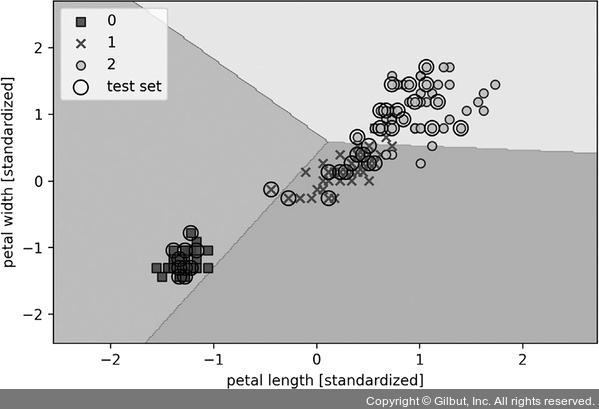
▲ 그림 3-1 퍼셉트론 모델이 만든 붓꽃 데이터셋의 결정 경계