from sklearn.model_selection import LearningCurveDisplay
display = LearningCurveDisplay(train_sizes=train_sizes,
                               train_scores=train_scores,
                               test_scores=test_scores,
                               score_name='Accuracy')
display.plot(score_type='both')
plt.legend(loc='lower right')
plt.show()
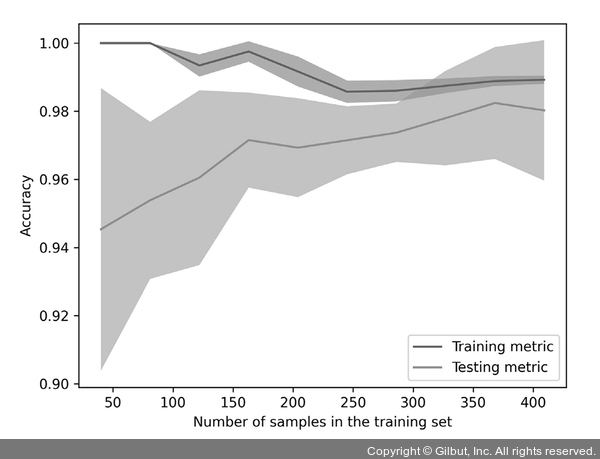
▲ 그림 6-7 LearningCurveDisplay 클래스로 그린 학습 곡선