>>> plt.plot([0, 1, 1], [1, 1, 0],
...          linestyle=':', color='black',
...          label='Perfect performance')
>>> plt.xlim([-0.05, 1.05])
>>> plt.ylim([-0.05, 1.05])
>>> plt.xlabel('Recall')
>>> plt.ylabel('Precision')
>>> plt.legend(loc="lower left")
>>> plt.show()
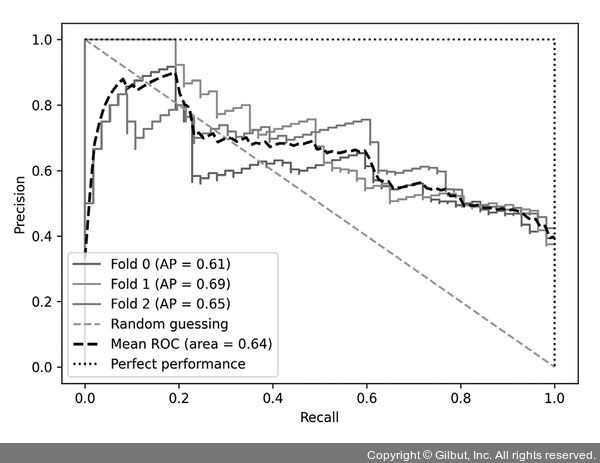
▲ 그림 6-17 PrecisionRecallDisplay 클래스로 그린 정밀도-재현율 곡선