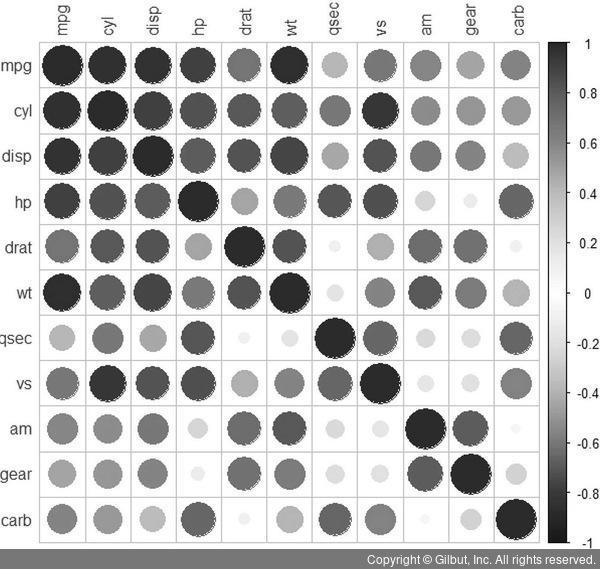
6.5 R 실습
1. 상관관계 분석하고 시각화하기
>>> install.packages("corrplot") >>> library(corrplot) >>> data(mtcars) >>> mtcars.cor = cor(mtcars) # method 파라미터로는 square, ellipse, number, shade, color, pie 등이 있다 >>> corrplot(mtcars.cor, method="circle")
1. 상관관계 분석하고 시각화하기
>>> install.packages("corrplot") >>> library(corrplot) >>> data(mtcars) >>> mtcars.cor = cor(mtcars) # method 파라미터로는 square, ellipse, number, shade, color, pie 등이 있다 >>> corrplot(mtcars.cor, method="circle")