1. 상관관계 분석하고 시각화하기
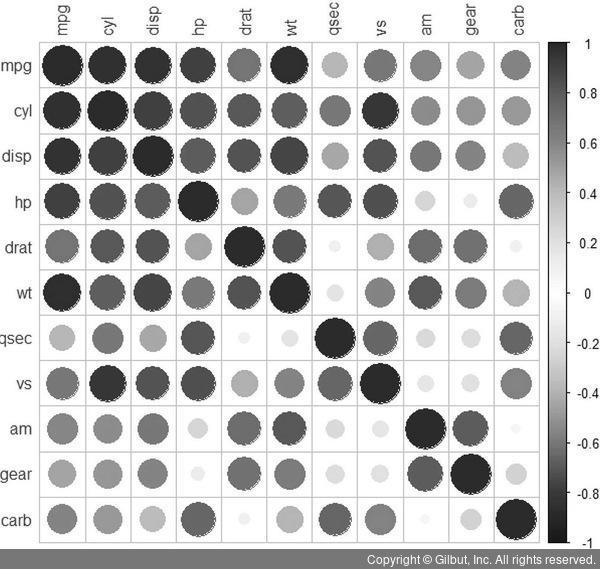
>>> install.packages("corrplot")
>>> library(corrplot)
>>> data(mtcars)
>>> mtcars.cor = cor(mtcars)

# method 파라미터로는 square, ellipse, number, shade, color, pie 등이 있다
>>> corrplot(mtcars.cor, method="circle")
엄선한 추천 도서와 신규 콘텐츠를 이메일로 보내드립니다.새로운 책이 등록될 때마다 소식을 받아보세요.