검색 결과 페이지에서 스크롤을 내려 Pyplot tutorial을 클릭합니다.
그림 13-3 검색 결과 중 Pyplot tutorial 클릭
내용을 살펴보면 지금까지 배운 내용들이 잘 정리되어 있습니다. 그중에서 다음과 같은 코드와 실행 결과가 보입니다.
import matplotlib.pyplot as plt
import numpy as np
t = np.arange(0., 5., 0.2)
plt.plot(t, t, 'r--', t, t**2, 'bs', t, t**3, 'g^')
plt.show()
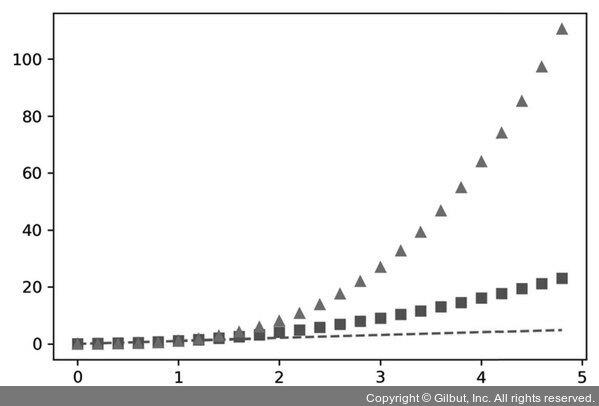
그림 13-4 Pyplot tutorial 페이지에서 네 번째 그래프